
How to Track Investments With Microsoft Excel
Investing can be confusing, and it’s easy to lose track of where your money is going. Thankfully, Microsoft Excel has many tools that can help you effortlessly track your investments.
Excel offers many ways for users to easily track their investments, such as by tracking the value of their portfolio over time, analyzing past performance, and comparing how different asset classes performed in similar market conditions.
Excel can also help investors stay on top of balances and transaction activity across multiple accounts. It allows them to visualize how these transactions affect their total wealth over time. This information can help investors decide when to invest more or pull out some cash for other uses.
Excel can be beneficial for investment tracking, especially if you’re saving for retirement and want to see how much progress you’ve made over time.
You can either enrol in Excel training to learn a few tips or tricks to analyze your investment data (which will serve you well for life), or you can follow the guide below for a quick solution.
Table of Contents
Create a Portfolio
A portfolio is a collection of individual investments held by an investor. A typical portfolio will include stocks, bonds, mutual funds, exchange-traded funds (ETFs), options, and other securities.
If you’re looking to create a portfolio in Excel, here’s how to do it:
1. Open up the spreadsheet application on your computer,
2. Click on ‘File’ and select ‘New’.
3. Select ‘Blank Workbook’ from the new screen’s drop-down menu. This will open up a new file for you to start creating your portfolio in Excel.
4. Type the heading ‘Accounts’ in one of the columns. The accounts should be listed from largest to smallest by value or assets under management (AUM). We recommend listing these accounts as rows instead of columns to make it easy to track.
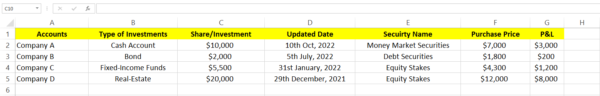
5. Create columns for the type of investment you have in your portfolio against each account. These include cash accounts, bonds, fixed-income funds, stocks and equity funds, commodities, and other assets like real estate or intellectual property rights.
6. Now create another column with the heading ‘Shares/Investment’ and enter the data for each investment appropriately.
7. You can add columns related to Date, Security Name, Number of Shares or Units Owned, Purchase Price Per Share/Unit (or Cost Basis), and Current Market Value Per Share/Unit (or Current Value). In addition, add columns for Cost Basis (the original purchase price), Gain/Loss Per Unit, and Total Gain/Loss For All Units (for each security).
8. You may also want to include columns for Percent Gain/Loss.
9. Save the spreadsheet as an Excel file and then close it.
Use the ‘Difference Formulas’ in Excel
Excel’s most useful feature is its ability to calculate differences between two numbers. For example, if you have a list of investment values and you want to know how much money you have made since your purchase, you can try the following method:
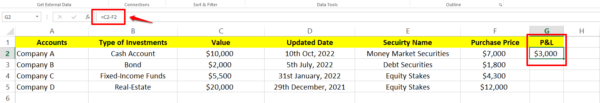
1. Click the cell where you want to calculate the difference between your asset’s current price minus its original purchase value.
2. Type the equal sign ‘=’ and then select the cell containing the current value of your investment.
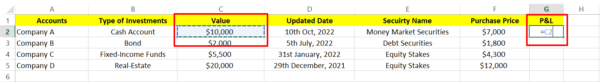
3. Type the minus sign ‘-‘ and then select the cell containing the original purchase price of the investment.
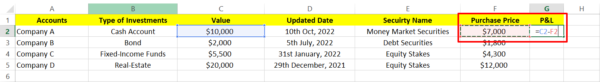
4. Press enter, and the difference will be calculated.
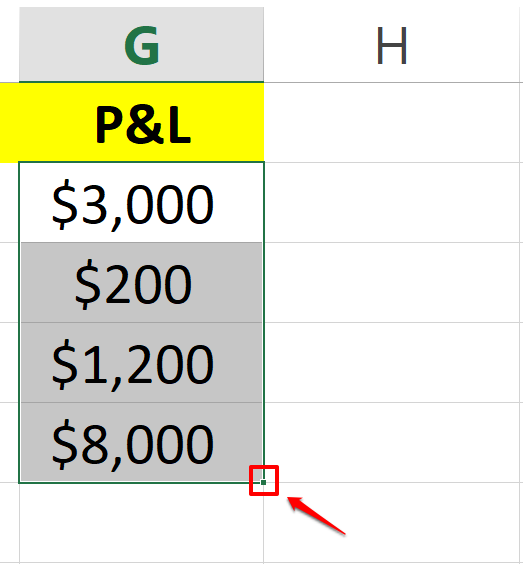
5. Now click and press the small square at the end of that cell (containing the difference), and drag it downwards to calculate the difference of each dataset automatically.
Use the ‘Percent Return Formulas’ in Excel
To track the return on investment over time, you can use Microsoft Excel’s percent return formulas. These formulas calculate the percentage increase or decrease in an investment’s value over time.
The formula for percent return is: (Current price – Purchase price) ÷ Purchase price
Here’s how you can apply the percent return formula in Excel:
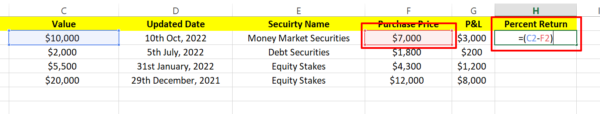
1. Select the cell where you want the percent return formula to be calculated.
2. Type the equal sign ‘=’ and add an open parenthesis ‘(‘.
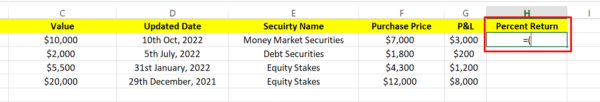
3. Select the cell containing the current value of your investment.
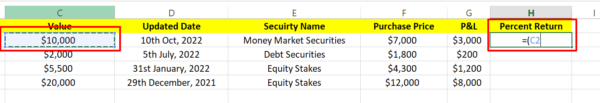
4. Type the minus sign ‘-‘ and select the cell containing the original purchase price of your investment and then close the parenthesis ‘)’.
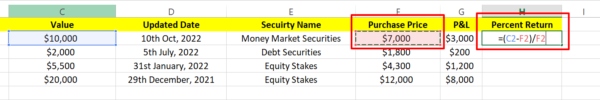
5. Now, type the forward slash ‘/’ and select the cell containing the original purchase price.
6. Press enter, and the percent return will be calculated.
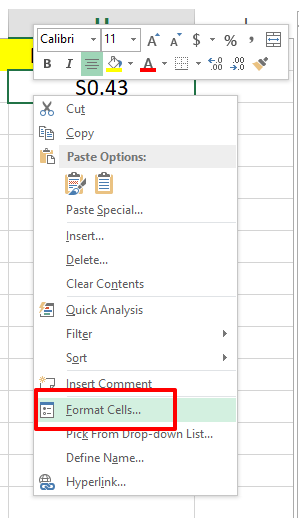
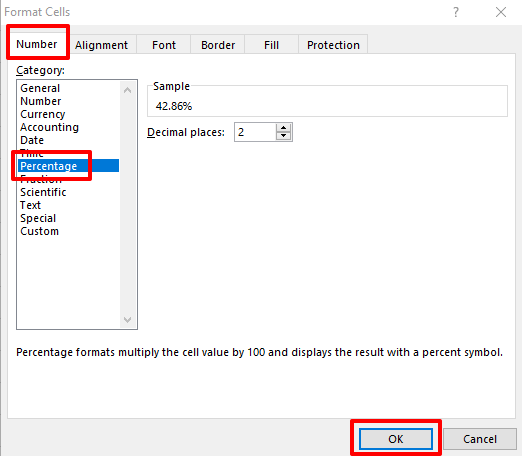
7. To make values appear as percentages, right-click on the cell, select the option of Format Cells, and select Percentage under the number tab.
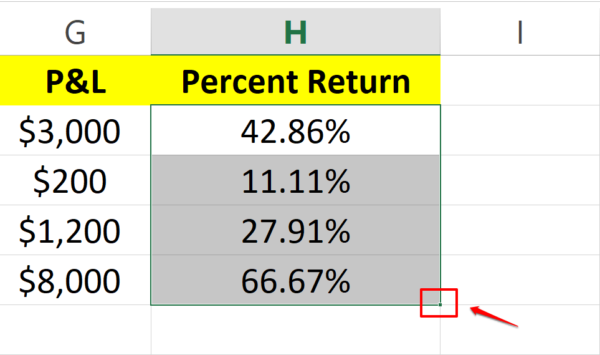
8. Once done, click and drag the small square at the bottom right corner of your percent return cell and copy the formula for the rest of the dataset.
Use Advanced Excel Features to Customize your Sheet
Functions in Excel are a way for you to manipulate data in Excel programmatically. They can be used to perform calculations, transform data, and create new values.
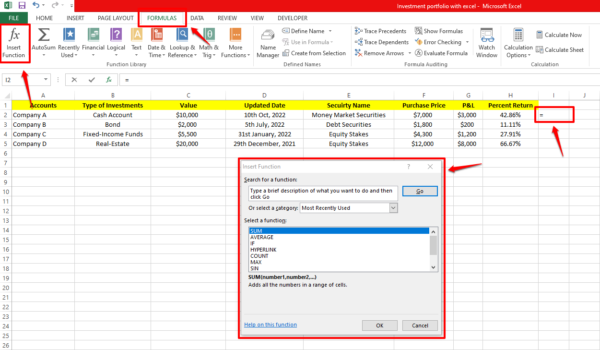
You can find a list of all built-in functions in the Formula tab menu in Excel. To access it, click on any cell, navigate to the Formula tab and choose the ‘Insert Function’ option. The Insert Function dialogue box will appear, from where you can choose the function you are looking for by going through the list.
Here are the 10 most popular functions in Excel:
- SUM function
- IF function
- LOOKUP function
- VLOOKUP function
- MATCH function
- CHOOSE function
- DATE function
- DAYS function
- INDEX function
- FIND, FINDB functions
The best way to learn about each function is by using it. Try out different arguments and see what happens.
To Conclude
Excel is an excellent way to track investments because it saves and calculates dependable data. Also, you can use the program to graph your data and see how they change over time.
Thank you to my friends at Acuity Training for an informative guest article.
I use Excel spreadsheets for keeping track of my self-employed earnings and send them to my accountant once a year so that he can produce my annual accounts from them.
I do also use Excel for keeping track of my investments, but only in a very basic way. This article has inspired me to be a bit more ambitious with Excel and use formulas to automatically calculate the total and percentage returns from my investments, and so forth.
As always, if you have any comments or questions about this post, please do leave them below.
November 2, 2022 @ 1:46 pm
Oh my gosh, anything to do with Excel and im done, the devils programme ha…. but I admire your patience!
November 2, 2022 @ 2:22 pm
Lol, Rachel. Excel does require patience at times, but it does save an awful lot of time and effort compared with doing things the old-fashioned way!
November 2, 2022 @ 2:05 pm
I love Excel, it has so many amazing functions and can do so much. I use it for keeping track of my expenses and blog income too.
November 2, 2022 @ 2:19 pm
Thanks, Jenny. Yes, me too. When I started out in self-employment many years ago I kept all my business income and expenditure records in an analysis book and did all the sums myself. I would hate to have to go back to that system now!